
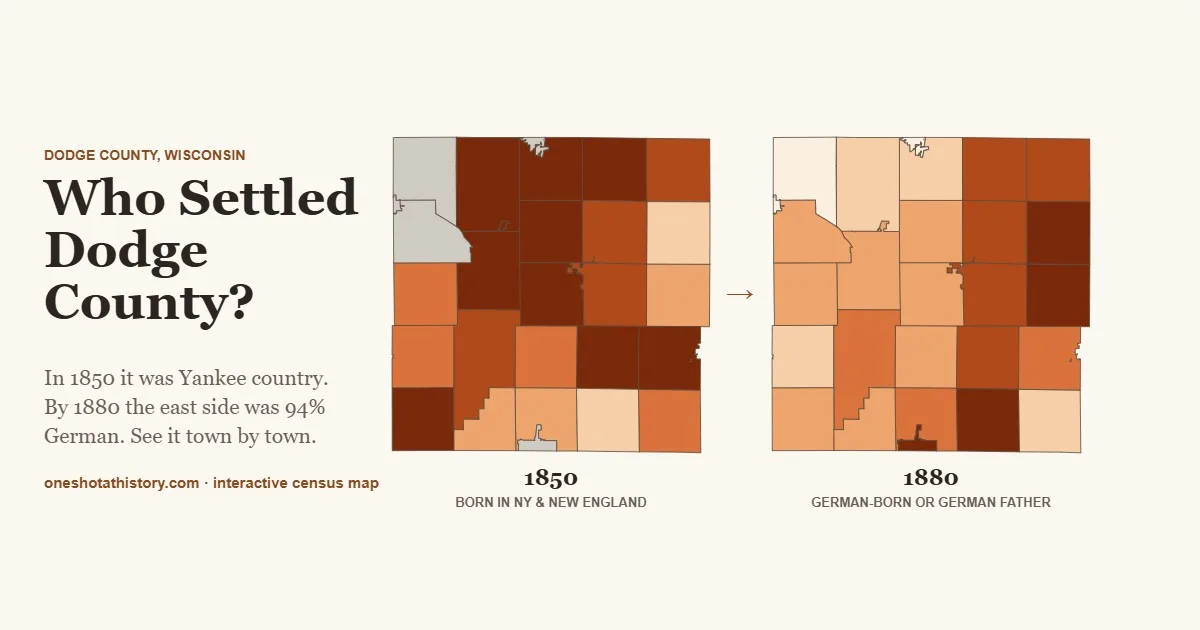

In 1850, if you stopped a farmer on the section roads around Horicon and asked where he was from, four times in ten the answer was New York or New England. Thirty years later, in the towns along the east side of Dodge County, eight or nine in ten families answered Germany, or had a father who would have. I wanted to see exactly how that happened, town by town. So I mapped every person in the census.

The result is Who Settled Dodge County?, a new interactive map built from 112,170 census records from 1850, 1870 and 1880. Pick any group and any year, and every town lights up with its share of residents born there. Swipe between two maps side by side. Fade the colors to see the 1840 territory map, the original land surveys or the 1873 and 1890 plat atlases underneath. And now you can lay the original land patents, all 7,577 of them, under the whole thing, along with the treaty lands that were taken from the Ho-Chunk, Potawatomi, Odawa and Ojibwe before any of it could be sold.
Before the patents: whose land was it?
None of the 7,577 land sales on this map could happen until the land had been taken from the people who lived here first. Dodge County was split between two treaties signed a year apart, and the dividing line was the Rock River itself.
West of the river was Ho-Chunk land. In the Treaty of Fort Armstrong, signed September 15, 1832, right after the Black Hawk War, the Ho-Chunk were pressed to give up everything south and east of the Fox and Wisconsin rivers, along a boundary that ran “up Rock river to its source.” They were to be gone by June 1, 1833. East of the river was land held by the Potawatomi and their Odawa and Ojibwe relatives, who gave it up in the Treaty of Chicago on September 26, 1833, and agreed to move west of the Mississippi within three years. The government removed both peoples again and again, but many came home, and the Ho-Chunk Nation and the Forest County Potawatomi Community are still in Wisconsin today.
Lay the treaty lands over the census and something jumps out. The 1832 side, opened first, is where the Yankees settled: every land patent from 1840 to 1843 lies west of the river, and the first one east of it dates from 1844. The 1833 side became the most German corner of the county, with Theresa at 94 percent German stock in 1880, Herman at 91 and Lomira at 82. The line that divided the settlers’ two worlds had been drawn by two treaties a year apart.
Five things the census books reveal
1. Dodge County started out as Yankee country
The first wave came west on the Erie Canal and the Great Lakes. In 1850, 29 percent of the county had been born in New York and another 12 percent in New England. In Burnett, Beaver Dam and Oak Grove, close to six in ten residents were Yankee-born. They built the first mills and laid out many of the first villages. Only the eastern edge was different: in Theresa and Lebanon, Yankees were barely one in eight. The Germans were already there.
2. Then the east turned German, and mostly Prussian
By 1870, German-born residents outnumbered Yankee-born ones about two to one across the county. That year the census started recording which German state people came from, and the answer was overwhelmingly Prussia. In Theresa, 43 percent of all residents had been born in Prussia. In Lebanon, 39 percent. Put Yankee-born 1850 on one side of the map and German stock 1880 on the other, and the line between the two worlds runs right down the middle of the county.
3. Count the children and the picture changes
Here is the part that surprised me. In 1880 only 36 percent of Hubbard, home to Horicon, had been born in Germany. But the 1880 census also asked where each person’s father was born. Count the immigrants together with their Wisconsin-born children and Hubbard was 74 percent German. Theresa was 94. Herman, 91. Lebanon, 85. Lomira, 82. Meanwhile Fox Lake on the west side was just 15 percent. The stock themes on the map show that hidden second generation.
4. Little pockets of the old world
Switch to the smaller groups and the surprises keep coming. In 1850, a third of the people in Calamus had been born in Wales, and 14 percent of Elba’s. Ashippun had a Norwegian settlement large enough that Norwegian-born residents still outnumbered German-born ones in 1880. The Irish made up nearly a quarter of Emmet in 1850, and were still the largest immigrant group in Elba thirty years later.
5. Farm towns shrank while factory towns boomed
Between 1890 and 1910 every rural town in Dodge County lost people. Theresa and Rubicon each lost about a quarter of their residents. The cities went the other way: Mayville nearly doubled, from 1,165 to 2,282, in the years of the Northwestern Iron Company, while Beaver Dam grew 60 percent, Juneau 43 and Horicon 39. The settlers’ grandchildren were leaving the farm for the factory. Turn on Population change 1890–1910 to watch it.
Things to try on the map
- Who bought the land, and who came after? Switch on Original land patents to 1868. The census colors fade so the parcels show through, and one click shows the buyer, the date and a link to the original patent, then the town’s birthplaces.
- See whose land it was first. Switch on Treaty lands, 1832 & 1833 and click anywhere for the treaty that took that land and the nations who carry on today. Then put it in Compare against German stock 1880 and watch the Rock River line up with the German east side.
- Swipe the decades. Open Compare and put Yankee-born 1850 on the left and German stock 1880 on the right. Drag the bar.
- Find the Welsh. Choose Welsh-born 1850, then pick the 1873 Plat Atlas underneath and fade the colors. Zoom in on Calamus and read the names on the farms.
- Follow the Prussians. Compare Prussian-born 1870 with Mecklenburg-born 1870 and see where each group put down roots.
- Share what you find. Share view copies a link to exactly what you’re looking at, comparison and all.
How I built it
Every ten years a census taker walked every road in Dodge County and wrote down each person and where they were born. Those pages now live in a database of the complete census returns at the University of Minnesota. The hard part was the town: I matched every Dodge County entry to the town it was written in using the Census Place Project, combing through close to three gigabytes of national files. Then came the counting, more than 80 numbers for every town, checked against the printed census reports until the totals matched to the person.
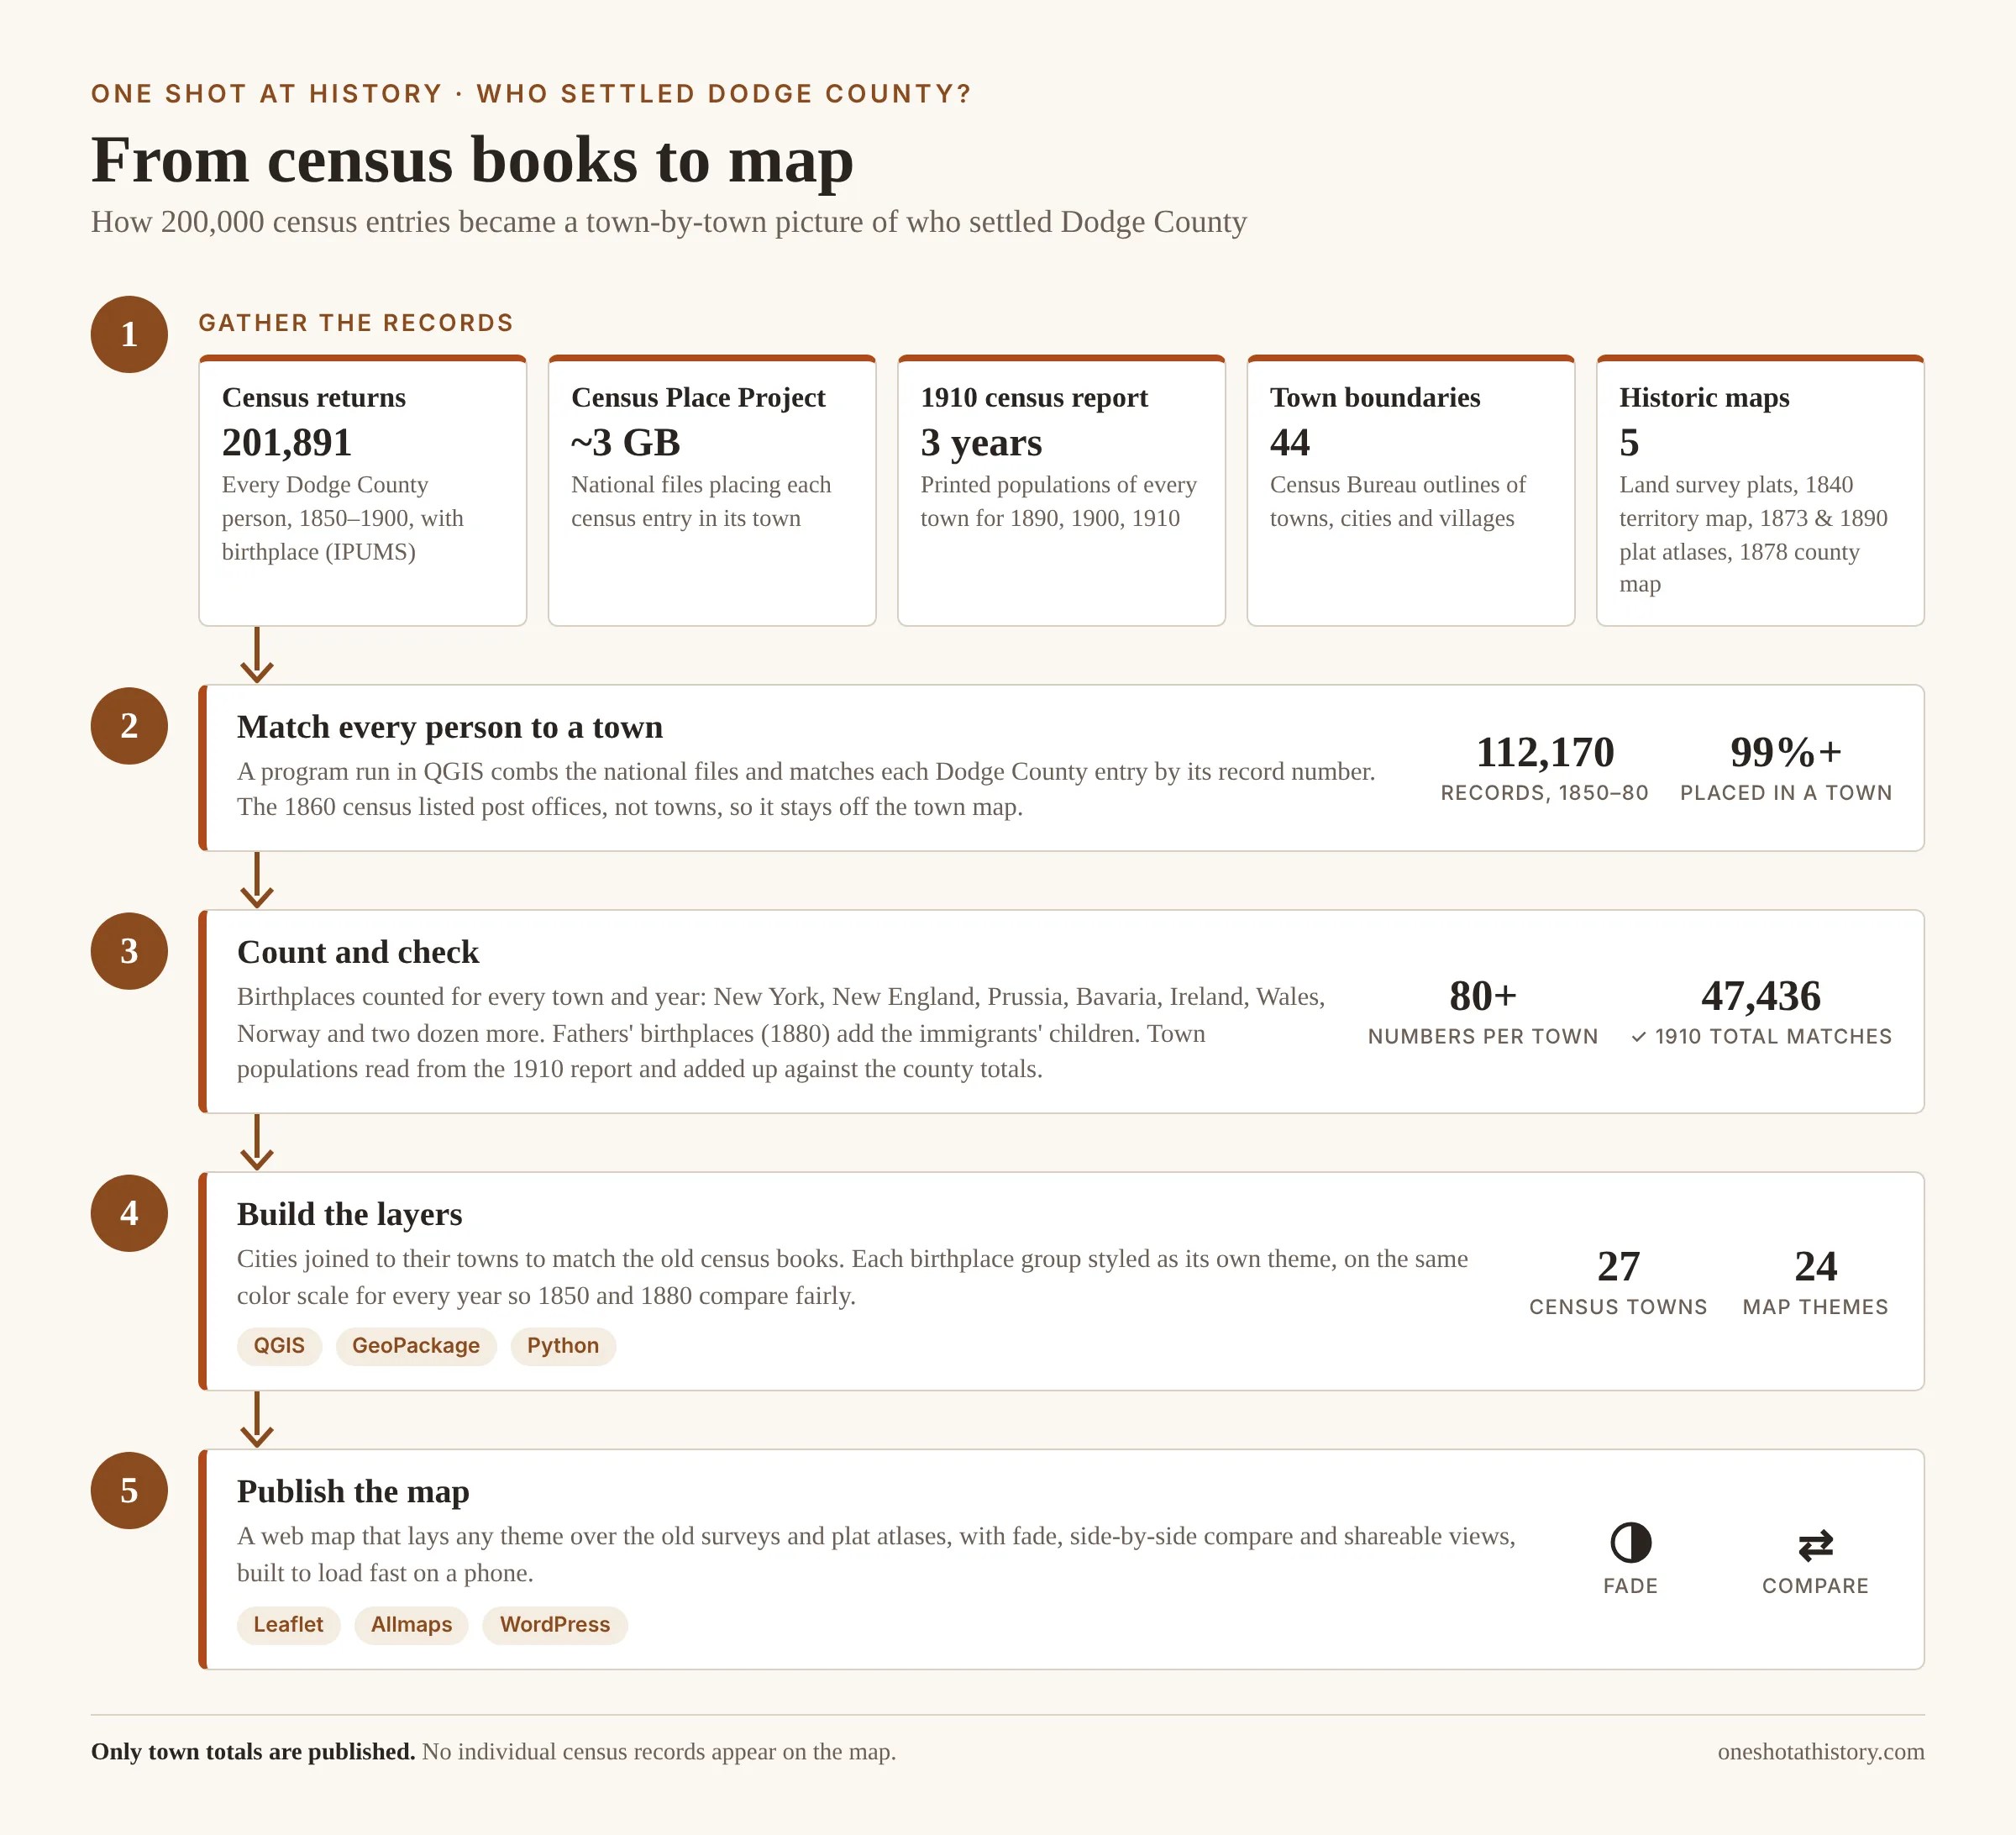
The full story of the data, the software and what the census couldn’t tell me is on the map page. Only town totals are published; no individual census records appear on the map.
What’s your family’s story?
Numbers only go so far. If your family came to Dodge County from Pomerania, Wales, Norway, County Cork or upstate New York, or if you have a church record, a letter or a plat book that adds to the picture, I’d like to hear from you at oneshotathistory@gmail.com. The best stories may end up on the map, and on the podcast.
Sources: IPUMS USA full-count census data, University of Minnesota; Enrico Berkes, Ezra Karger and Peter Nencka, The Census Place Project (openICPSR 179401); U.S. Census, 1910, Vol. III, Table 1; Bureau of Land Management, General Land Office Records; U.S. Census Bureau TIGER/Line boundaries; Treaty with the Winnebago, 1832 (7 Stat. 370) and Treaty of Chicago, 1833; C. C. Royce, Indian Land Cessions in the United States (1899), via the USDA Forest Service; Rock River from OpenStreetMap. Full credits.
